5 Why Analysis is a simple approach for exploring root causes and instilling a “Fix the root cause, not the symptom,” culture at all levels of a company. The 5 Why Analysis was originally developed by Toyota founder Sakichi Toyoda and was later used within Toyota Motor Corp. during the development of the Toyota Product System (TPS). At Toyota, 5 Whys is still a critical component of problem-solving training, and the method is still widely applied within the company when problems occur. “Toyota Business Practices dictates using the ‘Five Whys’ to get to the root cause of a problem, not the ‘Five Whos’ to find a fire the guilty party.” – Jeff Liker, The Toyota Way It can be used whenever the real cause of a problem or situation is not clear. Using the 5 Whys is a simple way to try solving a stated problem without a large detailed Continue reading
Operations Management Concepts
Basic Principles of Total Quality Management (TQM)
Total Quality Management ensures maximum effectiveness and efficiency within a business and secures commercial leadership by putting in place process and systems which will promote excellence and prevent errors. It ensures that every aspect of the business is aligned to the customer needs and the advancement of business goals without duplication or waste of efforts. Different companies have different approaches to implement Total Quality Management (TQM). The following principles (which are common to all companies) must be adhered for the successful Total Quality Management (TQM) implementation: Continuous improvement. TQM is a long-term process that entails achieving improvements in the company’s operations. This means that management should establish targets for improvement and measure progress by using reliable criteria. The quest for quality and better service to the customer should be a continual, never-ending one. Competitors will seek to provide better service and customers will come to expect it. Hence, to cease Continue reading
Case Study: How Total Quality Management Help Xerox Back on Track
Xerox Corporation is an American company founded in 1906 as Haloid Company. The company began as a manufacturer of photographic paper and equipment. Joseph Wilson inherited the business from his father who was the founder of the company and propelled it to new heights. Wilson signed an agreement with Chester Carlson to develop Carlson’s idea of printing using the toner commercially. The technology was named Xerography. The company changed its name to Haloid Xerox in the year 1958 and subsequently in 1961 to Xerox Corporation. Xerox has a presence in over 180 countries worldwide, and it employs over 140,000 people. The company deals in document management, business process solutions and software services. Xerox Company provides a multitude of products and services to its clients worldwide. They include business services, office equipment, and production equipment. The company’s dynamic nature has enabled it to survive technological changes in the industry. Xerox has made several Continue reading
Types of Inventory System (Q and P Models)
The term inventory derives from the French word inventaire and the Latin word inventariom which simply means a list of things which are found. The term inventory includes materials which are in raw form, or are in process, in the finished packaging, spares and the others which are stocked in order to meet all the unexpected demands or distribution in the future. This term usually refers to the stock at hand at a particular period of time of all those materials which are in raw form, those goods which are in progress of manufacture, all the finished products, merchandise purchased products for resale of those products, tangible products which can be seen, touched, measured or are countable. In a connection with the financial statements and records of accounting, the reference may be to the amount assigned to the stock or the pile of goods owned by an enterprise at a Continue reading
Quality Management Tools: Pareto Analysis
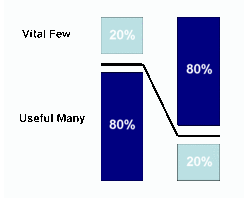
Pareto analysis is a very simple technique that helps a manager to choose the most effective changes to make. It is represented as a bar graph used to arrange information in such a way that priorities for process improvement can be established. Pareto charts are constructed to provide a before-and-after comparison of the effect of control or quality improvement measures. The Pareto Effect The 80:20 theory was first developed in 1906, by an Italian economist, Vilfredo Pareto, who observed an unequal distribution of wealth and power in a relatively small proportion of the total population. This fact gave rise to the Pareto effect or Pareto’s law: a small proportion of causes produce a large proportion of results. Thus frequently a vital few causes may need special attention wile the trivial many may warrant very little. It is this phrase that is most commonly used in talking about the Pareto effect Continue reading
Goldratt’s Theory of Constraints – Constraint Management
An Israeli physicist, Eliyahu Goldratt wrote a book titled ‘The Goal’, about a factory manager’s quest to save his factory from being closed down for lack of profitability. It chronicles the process that the manager and his staff go through as they learn how to save their factory. What they learn is how to apply the principles of what Mr. Goldratt calls the “Theory of Constraints.” Theory of Constraints (TOC) is a logic-driven approach which focuses on system improvement. The core idea of TOC is that every organization has at least one constraint that prevents management from achieving the goal of the organization to a larger degree. A system can be defined as a collection of interrelated, interdependent components or processes that act in concert to turn inputs into defined outputs in pursuit of a particular goal. Linking systems to chains, TOC defines weakest link as a Constraint. Constraint limits Continue reading


