Based on the law of demand, a change in price can be described in terms of income and substitution effect. The diagram presented below will be used to explain these effects.
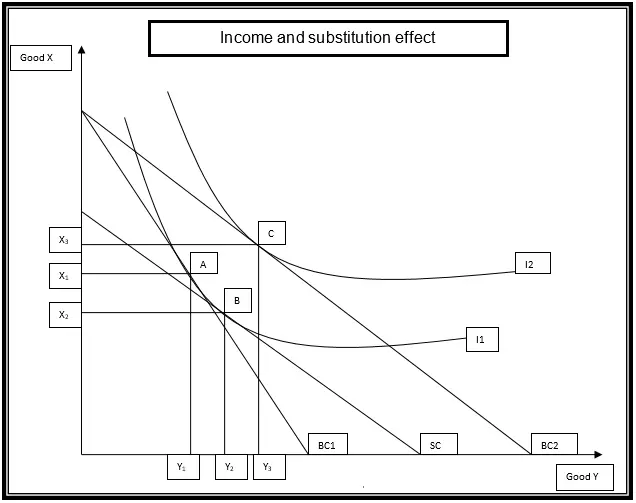
The two items that will be analyzed are commodity Y and X. According to the law of demand, a drop in the price of commodity Y will lead to an increase in quantity demand. The increase will cause the budget line to pivot from BC1 to BC2. Also, the indifference curve will shift from I1 to I2. This represents a movement to a higher indifference curve. The equilibrium position is the point of tangency between the budget line and the indifference curve.
When the price of commodity Y falls, a consumer will be indifferent between consumption at point A and B because they lie on the same indifference curve. However, at point B, the consumer shall not have exploited the budget. A fall in price increases the quantity of commodity Y that can be consumed as represented by budget line BC2. This shows that real income has grown as a result of a drop in price. Thus, the consumer can increase consumption to point C on a higher indifference curve I2 from point B on a lower indifference curve. At this point, an individual will consume Y3 and X3 of commodity Y and X, respectively.
Thus, the movement from Y2 to Y3 is due to the income effect. The change from point A to B is known as the substitution effect. This can be attributed to the fact that the individual will reduce consumption of X, from X1 to X2, and increase the use of commodity Y, from Y1 to Y2. It can be observed that this occurs on the same indifference curve I1. It implies that the consumer is substituting Y with X. The total effect is the sum of income and substitution effect, that is, the sum of the movement from Y1 to Y2 (substitution effect) and change from Y2 to Y3 (income effect).